
- Types of income statement templates
- Core components to include in an income statement
- Steps to prepare an income statement
- How do you analyze an income statement?
- Benefits of using income statement templates
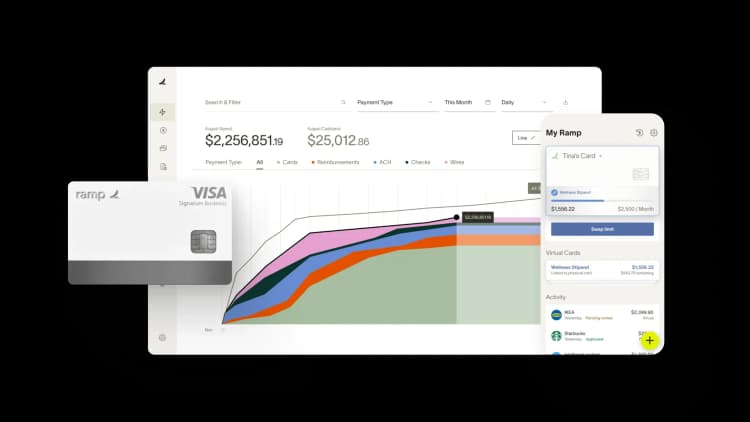
- Utilize Ramp for automation
An income statement, also known as a profit and loss statement (P&L), is a key financial report for any business. It details how much money the business made (revenues), how much it spent (expenses), and what was left over (profit or loss) during a specific period, like a quarter or a year.
This statement helps you understand whether your business is making money or losing it. It also shows areas where you might be spending too much or not earning enough, which is important for making better budgeting and investment decisions.
In this article, you will explore different types of income statement templates, their advantages, and key elements. You will also learn the step-by-step process on how to use these templates effectively.
Types of income statement templates
Get Ramp's free income statement template
Income statements come in two main types, each suited to different business sizes and financial complexities. Understanding these templates can help you choose the right one for your business needs.
Single-step income statement
A single-step income statement is straightforward to prepare. It consolidates all revenues and expenses, allowing you to calculate the net income by subtracting total expenses from total revenues.
Net Income = (Revenues + Gains) – (Expenses + Losses)
This template is ideal for small businesses or sole proprietorships with simpler financial structures. It provides a clear overview without breaking down individual operational costs, making it easy to understand and use.
Multi-step income statement
A multi-step income statement offers a more detailed company financial performance analysis. It separates operating revenues and expenses from non-operating ones, providing a clearer picture of the core business activities.
This template is handy for larger businesses with more complex financial transactions. It breaks down the financial data into gross profit, operating income, and net income, offering a comprehensive view of economic health.
Key components of a multi-step income statement:
- Gross profit
Calculated by subtracting the Cost of Goods Sold (COGS) from total revenue. EBIT is an abbreviation for “Earnings Before Interest and Taxes.”
Gross Profit (EBIT) = Total Revenue − Cost of Goods Sold (COGS)
- Operating income
Determined by subtracting operating expenses from gross profit.
Operating Income = Gross Profit − Operating Expenses
- Net income
In the multi-step statement net income is calculated using operating income and non-operating expenses.
Net income = Operating Income + Non-operating Items
Net income = (Revenues + Non-operating items) – (Cost of goods sold + Operating expenses)
Whether you opt for the simplicity of a single-step income statement or the detailed analysis provided by a multi-step income statement, having the appropriate template can streamline your accounting processes and improve financial clarity.
Core components to include in an income statement
Here's a breakdown of the key elements that should be included in an income statement:
- Revenue
Record your business's income from sales and services during the reporting period. This figure represents the total revenue and is a crucial starting point for analyzing your financial performance.
- Cost of goods sold (COGS)
Include the direct costs of producing the goods or services your company sells. This might include materials, labor, and other expenses directly tied to production. COGS is essential for understanding the cost efficiency of your business operations.
- Gross profit
To determine your gross profit, subtract the COGS from your total revenue. Gross profit indicates how profitable your core business activities are before accounting for any operating expenses.
- Operating expenses
List all the regular expenses your business incurs to keep running, such as rent, utilities, salaries, and office supplies. These are known as operating expenses, and they play a significant role in determining your overall profitability.
- Operating profit (EBIT)
Subtract your operating expenses from the gross profit to calculate your operating profit, also known as EBIT (Earnings Before Interest and Taxes). This figure shows how much profit your business generates from its core operations, before considering non-operating income and expenses.
- Non-operating income
Include any additional earnings that come from activities outside your core business operations, such as investment income. This income is important for understanding all the sources contributing to your overall financial health.
- Net profit
Calculate your net profit by subtracting all expenses, including taxes and interest, from your total revenue. This final figure represents the total profit or loss your business has made during the reporting period, giving you a clear picture of your financial performance.
Here is an example of an income statement template.

Steps to prepare an income statement
Understanding how to create an income statement is vital for any business. While using an income statement template can simplify the process, learning to prepare one manually is equally beneficial. Here’s a comprehensive guide to help you create an income statement:
1. Choose a reporting period
Selecting the right reporting period is crucial because it defines the timeframe your income statement will cover. Common periods include monthly, quarterly, and annually.
A monthly report offers detailed insights into short-term performance, allowing you to make tactical adjustments for the next month. Quarterly or annual reports provide a broader overview, helping to identify trends and inform strategic decisions.
2. Generate a trial balance report
Prepare a trial balance report, which lists all the account balances in your general ledger. Most accounting software can generate this report for you.
Download the trial balance report template here.
3. Calculate revenue
Calculate the total revenue generated during the chosen reporting period. This includes all income from sales and services. If you're preparing an income statement for the entire company, include revenue from every business line. For a segment-specific statement, only include revenue from the relevant products or services.
4. Determine the cost of goods sold
Determine the total Cost of Goods Sold (COGS) for the period. COGS includes all direct costs associated with producing the goods or services sold, such as direct labor, raw materials, manufacturing supplies, and any other expenses directly tied to production. This figure is critical for calculating gross profit and understanding the direct costs impacting your business's profitability.
5. Compute gross margin
Subtract the COGS from your total revenue to calculate gross profit. Gross profit indicates how much money remains after accounting for the direct costs of production. It reflects the profitability of your core business operations before deducting operating expenses. A high gross profit margin suggests efficient production, while a lower margin may indicate higher costs or pricing issues.
6. Calculate Operating Expenses (OPEX)
After gross profit, list all operating expenses. Operating expenses are the indirect costs necessary to run your business, such as rent, utilities, office supplies, salaries, and legal fees. Unlike COGS, these expenses are not directly tied to production but are essential for daily operations.
7. Calculate operating income
To find operating income, subtract operating expenses from gross profit. Also known as Earnings Before Interest and Taxes (EBIT), this figure shows the profit your business generates from its core operations before accounting for interest and taxes. Operating income provides insight into the profitability of your business’s primary activities and is a key indicator of financial health.
8. Apply income taxes
Identify any interest expenses your business incurred during the reporting period. This includes charges on outstanding debt, calculated based on the loan amount and interest rate.
Next, calculate your total tax liability, including local, state, and federal taxes, as well as payroll taxes. Accurately accounting for interest and taxes is essential, as these costs directly impact your net income.
9. Determine net income
Finally, calculate net income by subtracting interest and taxes from operating income. Net income represents the final profit after all expenses have been deducted. This figure reflects your business’s overall financial performance and can be allocated to reserves, distributed to shareholders, or reinvested into the business for future growth.
By following these steps, you can create a detailed and accurate income statement, providing valuable insights into your business's financial health and aiding in strategic decision-making.
How do you analyze an income statement?
There are two main ways to analyze an income statement to get a clear picture of a company’s financial health: vertical analysis and horizontal analysis. Here’s a simple breakdown of how each method works and what insights they offer:
Vertical Analysis
Vertical Analysis is a method where each item on a financial statement is expressed as a percentage of a base figure, such as total sales. This helps you see the relative size of each item, making it easier to compare across different periods or companies.
- Instead of just looking at dollar amounts, examine how each line item (such as expenses or revenue) relates to total sales.
- You can easily compare financial statements across different periods, industries, or companies by converting everything into percentages.
- This method helps you spot which costs are eating into profits or if revenue is being used efficiently.
Horizontal Analysis
Horizontal Analysis involves comparing financial data over multiple periods, showing changes in amounts and percentages over time. This technique helps identify trends, growth patterns, and potential issues by tracking how specific financial metrics evolve.
- Compare financial data from multiple periods (e.g., year-over-year) to see how your business is growing or where it’s declining.
- You can identify positive or negative trends by examining the increase or decrease in revenue, expenses, and profits over time.
- Determine if your company is improving its financial performance or if there are areas that need attention.
Using both methods together
Vertical analysis shows you the structure of your finances in the current period, while horizontal analysis tracks how these numbers change over time. Combining both analyses gives you a fuller understanding, helping you make smarter financial decisions for your business.
Benefits of using income statement templates
Using an income statement template offers numerous advantages compared to creating the statement from scratch each time. Small business owners without a dedicated accountant can particularly benefit from a template. Here are the key benefits.
- Save time by using income statement templates to streamline data entry and calculations, making the process quick and efficient. Focus on analyzing financial performance instead of spending time on repetitive tasks.
- Reduce errors with templates that include automatic calculations, minimizing the risk of mistakes that can occur with manual calculations. Ensure your financial data is accurate for making informed business decisions.
- Maintain consistency by using a standard format to track financial performance over time. Easily compare financial statements across different periods and identify trends or anomalies.
- Customize templates to fit your business needs, adjusting categories and sections as necessary. Tailor the income statement to include specific revenue streams, expense categories, or financial metrics.
Utilize Ramp for automation
Accurate financial reporting is essential for knowing whether your business is making or losing money. Small and large businesses need to maintain accurate financial records to avoid costly mistakes, especially when reporting to investors and regulatory bodies.
Ramp streamlines this process by automating your financial workflows, linking your expense tracking directly with your accounting software. Here’s how Ramp’s features can help:
- Eliminates the need for manual data input, reducing errors and saving time.
- Connect your expense tracking with accounting software, ensuring data flows smoothly and accurately.
- Helps you generate precise income statements with minimal effort.
- Speeds up report generation, allowing you to focus on other critical business areas.
By using Ramp, you simplify your financial reporting and ensure accuracy, helping you manage your business more effectively. Explore Ramp today!


“Most banks treat the back office as a cost to keep down. We treat ours as a return to compound, which is why we run it on Ramp. Now we put our clients on Ramp, too.”
Patrick Gaughen
President & COO, Hingham Institution for Savings

“Browserbase builds infrastructure so AI agents can do real work. Ramp is doing the same for finance. It’s not another tool. It’s a system purpose-built for AI-driven finance, and that’s why we chose Ramp as our financial operating system from day one.”
Paul Klein IV
Founder & CEO, Browserbase

“We used to pay up to $20k a year for our AP platform. With Ramp, we’re earning back well over that amount. That's money that belongs to the mission now, not to the back-office software.”
Heidi Coffer
Chief Financial Officer, Boys & Girls Clubs of San Francisco

“The tricky thing about corporate travel policy is timing. We didn't need a stricter policy. We needed the policy to show up earlier. With Ramp Travel, it finally does.”
Keith Frantz
Director of Enterprise Risk Management, Prosper

“We're accountable to our funders, our partners, and the families we serve. That accountability starts with how we manage every dollar. Ramp makes it easy for our team to spend wisely, track in real time, and keep overhead low so more resources reach the families navigating infertility.”
Rachel Fruchtman
CFO, Jewish Fertility Foundation

“Each member of our team has an outsized impact due to our focus on using high-leverage tools like Ramp.”
Lauren Feeney
Controller, Perplexity

“With Ramp, we haven’t had to add accounting headcount to keep up with growth. The biggest takeaway is that instead of hiring our way through it, we fixed the workflow so we can keep supporting the organization as we scale.”
Melissa M.
VP of Accounting at Brandt Information Services

“In the public sector, every hour and every dollar belongs to the taxpayer. We can't afford to waste either. Ramp ensures we don't.”
Carly Ching
Finance Specialist, City of Ketchum
