Year to date (YTD): What it means and how to calculate it

- What does year to date mean?
- Calendar year vs. fiscal year YTD
- Common YTD applications in business
- How to calculate year to date
- YTD in payroll and employee compensation
- YTD for investment returns
- YTD vs. other time period metrics
- Benefits and best practices for using YTD
- Automate YTD reporting with real-time syncing
Year to date (YTD) is the total from the first day of the year through today. It's a simple way to measure progress in real time, whether you're tracking business performance, payroll totals, or investment returns.
What does year to date mean?
Year to date (YTD) means the total of something from the first day of the year through the current date. It's a time-based measure often used in financial management and investing. Most North American companies define year to date using the calendar year, which starts January 1.
Some companies instead base year to date on their fiscal year, which may differ from the calendar year.
Calendar year vs. fiscal year YTD
YTD can be calculated using either the calendar year (starting January 1) or your company's fiscal year, depending on your reporting standards:
- Calendar year YTD: January 1 through today. This is the default for most individuals and businesses because it aligns with the standard calendar.
- Fiscal year YTD: From the start of a company's fiscal year through today. Many organizations choose a non-calendar fiscal year to better match seasonality, customer demand, or internal reporting needs.
Examples of different fiscal years
| Organization | Fiscal year cycle | Why this timing works |
|---|---|---|
| Apple | Ends late September | Closes books after back-to-school shopping peak |
| Schools & universities | Jul 1 – Jun 30 | Matches academic calendars and tuition payments |
| Retailers | Ends late January | Captures full holiday sales season before closing |
Common YTD applications in business
You can use year to date (YTD) figures to check progress against budgets and prior periods without waiting for year-end reports. YTD helps you see how revenue, business expenses, and overall results are pacing against annual goals.
YTD revenue and sales
Tracking YTD sales shows whether revenue is on pace to hit yearly targets. For example, if your company earns $50,000 in January, $60,000 in February, and $70,000 in March, the YTD revenue through March is $180,000. Comparing this total with your annual budget helps you forecast results and adjust strategy mid-year.
YTD expenses and budgeting
YTD expense data helps keep spending aligned with budgets. Suppose your software costs already total $80,000 out of a $120,000 budget halfway through the year, you'll know to adjust before overspending. Tracking expenses this way highlights trends and informs course corrections.
YTD financial reporting
Accountants rely on YTD figures to prepare financial statements and estimate tax liabilities. Reports often include YTD revenue, expenses, and net income, allowing comparisons with the same period in prior years.
For example, YTD net income of $450,000 through June compared with $400,000 the year before shows year-over-year improvement. YTD figures also help you estimate quarterly tax payments and plan for year-end tax liabilities, giving you time to adjust before filing deadlines.
How to calculate year to date
The YTD formula works for any financial metric you need to track over a partial year:
YTD= (Current value – Beginning value) / Beginning value * 100
This formula applies whether you're calculating profits, investment returns, or portfolio performance. That said, YTD measurement is more sensitive to early changes than later ones, so it's best used alongside other metrics like year-end, quarter-on-quarter (QoQ), or custom date ranges.
Step-by-step calculation process
- Identify the start date: Decide whether you're measuring from the beginning of the calendar year or your company's fiscal year
- Determine the end date: Select the cutoff date (usually today, though you can choose another date)
- Apply the formula: Use the values that match what you're measuring, such as revenues, expenses, stock prices, or portfolio values
Always exclude the current day when calculating YTD, since results for that day aren't yet complete.
YTD calculation examples
Business profits
A profit & loss (P&L) statement shows revenue, expenses, and profit for any period. Suppose your fiscal year starts on January 1. As of April 2, income totals $670,539 and expenses $340,708.
YTD profit= 670,539 – 340,708 = $320,831
Investment return
To calculate a stock's YTD return, subtract its price on the fiscal year's start date from its most recent closing price. Divide that difference by the start price, then multiply by 100.
YTD return= (Current price – Beginning price) / Beginning price * 100
Portfolio return
Imagine a portfolio that began the year at $100,000, with $70,000 in stocks and $30,000 in bonds. By June 30, the stocks are worth $77,000 and the bonds $32,000, for a total of $109,000.
YTD return= (109,000 – 100,000) / 100,000 * 100 = 9%
How to annualize YTD figures
Annualizing converts a partial-year figure into a projected annual figure so you can compare year to date returns on equal footing.
The annualization formula is:
Annualized return= (Current value / Beginning value) ^ (12 / Months elapsed) – 1
Then multiply by 100 to express as a percentage.
For example, suppose your portfolio is up 4% through June (6 months elapsed):
Annualized return= (1.04) ^ (12 / 6) – 1 = 0.0816, or approximately 8.2%
Annualization assumes consistent performance throughout the year, so it won't capture seasonality or one-time events that skew a single period.
YTD in payroll and employee compensation
Payroll is one of the most common places you and your employees will see year to date (YTD) figures. Pay stubs and payroll reports show cumulative earnings and deductions from the start of the year through the current pay period.
At year-end, your employer uses these YTD totals to prepare your W-2 form, which summarizes your annual earnings and tax withholdings for filing.
Understanding YTD on pay stubs
Most pay stubs display YTD totals alongside current pay. These figures help both you and your employees track earnings and withholdings throughout the year:
- YTD gross earnings: Total income earned since the start of the calendar or fiscal year, before any deductions
- YTD deductions: Cumulative taxes, benefit premiums, and retirement contributions withheld from paychecks
- YTD net pay: The amount actually taken home after deductions
For employees, YTD figures support tax planning and provide accurate income details for loan or credit applications.
For employers, they aid in budgeting, ensure compliance with payroll tax rules, and simplify preparation of year-end forms like the W-2.
Example: YTD payroll calculation
Suppose an employee earns $1,500 every two weeks. By the end of May (10 pay periods), their YTD gross earnings equal $15,000. If $3,000 has been withheld for taxes and $1,000 for benefits, their YTD net pay comes to $11,000.
YTD for investment returns
YTD returns show the gains or losses on an investment from the start of the year through today. The YTD return formula works the same way for investments. The key difference: Include dividends and distributions for a more accurate picture.
Calculating YTD investment returns
Suppose you bought a stock at $50 on January 1 and it's now trading at $60.
YTD return= (60 – 50) / 50 * 100 = 20%
If the stock also paid $2 in dividends during this period, you'd add that to your gain before dividing by the beginning price:
YTD return= (60 – 50 + 2) / 50 * 100 = 24%
Including dividends, interest, and other distributions gives a more accurate picture of total return.
Comparing YTD performance
To add context, compare YTD returns against benchmarks like the S&P 500 or Dow Jones Industrial Average. This shows whether your portfolio, or your company's investments, are underperforming or outperforming the market.
YTD analysis can also guide financial decisions such as rebalancing, shifting into safer assets, or increasing exposure to growth opportunities. In seasonal industries like retail or travel, YTD performance helps distinguish normal fluctuations from meaningful changes in fundamentals.
YTD vs. other time period metrics
YTD results are most useful when compared with other time-based metrics. Businesses often look at month-to-date (MTD), quarter-to-date (QTD), and year-over-year (YoY) to add context.
| Metric | Start date | Best for | Example |
|---|---|---|---|
| YTD | Jan 1 (or fiscal year start) | Annual progress tracking | Revenue through June |
| MTD | 1st of current month | Short-term campaign performance | June sales so far |
| QTD | 1st of current quarter | Quarterly earnings prep | Q2 revenue |
| YoY | Same period, prior year | Long-term trend analysis | Q1 this year vs. Q1 last year |
YTD vs. month-to-date (MTD)
MTD measures progress from the start of the month through today. It's useful for tracking short-term activity like campaigns or productivity.
For example, if you launch a marketing campaign at the start of June, MTD highlights its early performance without being diluted by prior months. Seasonal businesses can also use MTD to isolate peak months, such as April or May, for clearer trend analysis.
YTD vs. quarter-to-date (QTD)
QTD covers performance from the start of the current quarter through today. Public companies use QTD figures to prepare quarterly earnings reports, while private companies often use them as internal checkpoints.
QTD is a subset of YTD. For instance, in May, YTD covers January–May, while QTD only covers April–May. Together, they provide both a detailed quarterly snapshot and a broader year-to-date view.
YTD vs. year-over-year (YoY)
YoY compares performance in the same period across different years, such as January–September this year vs. last year. Unlike YTD, which is partial-year, YoY accounts for seasonality and provides a longer-term view of growth or decline.
Benefits and best practices for using YTD
Using year to date (YTD) figures helps you track performance in real time and make better business decisions. Done correctly, YTD reporting highlights strengths, flags issues early, and provides a solid basis for planning:
- Real-time tracking: Monitor performance as it unfolds without waiting for year-end statements
- Early trend detection: Spot growth opportunities or problems before they escalate
- Smarter decisions: Use cumulative data to guide hiring, budgeting, and investment choices
- Accurate records: Reconcile accounts often and keep entries up to date to ensure YTD figures are reliable
- Error prevention: Avoid mistakes like starting with the wrong balances or missing transactions, which can distort results
Common mistakes to avoid
- Forgetting to exclude the current day's incomplete results
- Using prior-year carryovers or wrong opening balances
- Overlooking transactions that leave gaps in the data
- Comparing YTD figures across companies with different fiscal years without adjusting for the time period
When applied consistently, YTD reporting gives you the clarity and confidence to make smarter, more timely financial decisions.
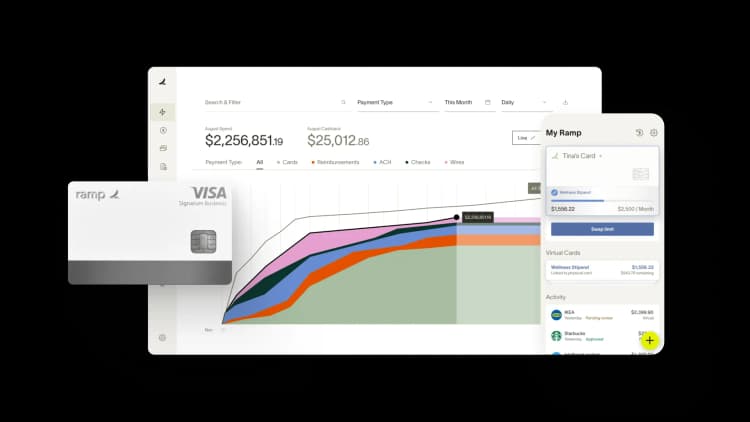
Automate YTD reporting with real-time syncing
Year-to-date financial reporting often requires hours of manual data gathering, reconciliation, and validation across multiple systems. You're pulling transaction data from credit cards, ERPs, and spreadsheets, then spending valuable time ensuring everything matches before you can even begin analysis.
Ramp's accounting automation software eliminates this manual work by automating the entire reporting pipeline from transaction to insight. Every expense is coded in real time using AI that learns your accounting patterns, so transactions land in the right accounts and categories as they happen.
Here's how Ramp streamlines YTD reporting:
- Real-time transaction coding: Ramp's AI codes transactions across all required fields as they post, applying your feedback to improve accuracy over time and ensuring consistent categorization
- Automated ERP sync: Ramp identifies in-policy transactions and syncs them to your accounting system automatically, so your books stay current without manual data entry
- Instant reporting visibility: Access YTD reports on demand with real-time data that reflects your current financial position, not last week's or last month's snapshot
- Automated reconciliation: Ramp's reconciliation workspace surfaces variances and missing entries automatically, so you can validate YTD figures with confidence
With Ramp's AI-powered accounting automation, you get accurate YTD reports whenever you need them, backed by data that's already coded, synced, and reconciled.
Try an interactive demo to see how Ramp improves financial visibility.

FAQs
Most pay stubs display YTD earnings, but you can also calculate it manually. Add up all payments you've received since the start of the year through your most recent paycheck. For example, if you earn $1,500 every two weeks and it's now the end of May (10 pay periods), your YTD gross earnings equal $15,000.
YTD net pay is the total an employee has taken home after taxes and deductions from the start of the year through the current pay period. It helps employees track actual earnings for budgeting and tax planning, and provides accurate income details for loan or credit applications.
To compare, look at the same YTD period across both years, for instance, January–September this year vs. last year. Then calculate the percentage change between the two totals. This shows whether performance is improving and highlights trends, seasonality, and areas where adjustments may be needed.
YTD on a pay stub shows your cumulative gross earnings, tax withholdings, and benefit deductions from January 1 (or your employer's fiscal year start) through your most recent pay period. It helps you track total compensation and plan for taxes before year-end.
Yes. If your company uses a fiscal year that starts on a date other than January 1, YTD runs from the fiscal year start date through the current date. For example, Apple's fiscal year begins October 1, so their YTD figures start from that date.


“Most banks treat the back office as a cost to keep down. We treat ours as a return to compound, which is why we run it on Ramp. Now we put our clients on Ramp, too.”
Patrick Gaughen
President & COO, Hingham Institution for Savings

“Browserbase builds infrastructure so AI agents can do real work. Ramp is doing the same for finance. It’s not another tool. It’s a system purpose-built for AI-driven finance, and that’s why we chose Ramp as our financial operating system from day one.”
Paul Klein IV
Founder & CEO, Browserbase

“We used to pay up to $20k a year for our AP platform. With Ramp, we’re earning back well over that amount. That's money that belongs to the mission now, not to the back-office software.”
Heidi Coffer
Chief Financial Officer, Boys & Girls Clubs of San Francisco

“The tricky thing about corporate travel policy is timing. We didn't need a stricter policy. We needed the policy to show up earlier. With Ramp Travel, it finally does.”
Keith Frantz
Director of Enterprise Risk Management, Prosper

“We're accountable to our funders, our partners, and the families we serve. That accountability starts with how we manage every dollar. Ramp makes it easy for our team to spend wisely, track in real time, and keep overhead low so more resources reach the families navigating infertility.”
Rachel Fruchtman
CFO, Jewish Fertility Foundation

“Each member of our team has an outsized impact due to our focus on using high-leverage tools like Ramp.”
Lauren Feeney
Controller, Perplexity

“With Ramp, we haven’t had to add accounting headcount to keep up with growth. The biggest takeaway is that instead of hiring our way through it, we fixed the workflow so we can keep supporting the organization as we scale.”
Melissa M.
VP of Accounting at Brandt Information Services

“In the public sector, every hour and every dollar belongs to the taxpayer. We can't afford to waste either. Ramp ensures we don't.”
Carly Ching
Finance Specialist, City of Ketchum
