
- Income statement
- Balance sheet
- Cash flow statement
- How do these statements work together to drive business decisions?
- Get real-time performance insights with Ramp's live reporting and AI-powered analytics
All three financial statements, including the income statement, balance sheet, and cash flow statement, offer a different view of your performance. This includes your profitability, stability, and liquidity, giving you a full picture of your business's health.
These statements do not just show numbers. Instead, they explain how money moves through the business, how assets are managed, and whether the company is growing, holding steady, or losing ground.
Finance teams, investors, and decision-makers rely on these three tools to assess performance, spot risks early, and plan for what’s next. If the data in these statements does not line up, it’s often the first sign that something’s off.
Income statement
The income statement shows whether a company is making money. It tracks revenue earned, expenses incurred, and the resulting profit or loss. This is calculated over a specific period of time, either monthly, quarterly, or annually.
This statement starts with total revenue, subtracts operating costs, income taxes, and interest, and ends with net income. If revenue exceeds expenditures, the company reports a profit. If not, it shows a loss.
It’s a real-time view of business performance. Unlike the balance sheet, which shows a snapshot, the income statement tells how well the company generated income and managed costs over time.
Most CFOs use the income statement to evaluate profitability trends and cost control efforts. It helps identify what drives revenue, where spending has increased, and which areas may need attention.
For growing companies, the income statement helps answer key questions: Are sales increasing? Are margins shrinking? Is the business scaling efficiently? Tracking these metrics reveals whether performance is improving or masking deeper issues.
When reviewed regularly, the income statement can guide better pricing strategies, budget decisions, and operational planning. It’s often the first document investors and analysts check to assess business viability.
For teams processing high transaction volumes, tools like Ramp’s AI-powered transaction categorization can help ensure revenue and expense data is consistently coded. This reduces the manual work and improves the accuracy of income statements.
What does the income statement measure?
The income statement measures how effectively a company turns revenue into profit. At its core, the income statement measures:
- Revenue: Total income from sales or services.
- Cost of goods sold (COGS): Direct costs tied to production or delivery.
- Operating expenses: Overheads like home office payroll, marketing, and rent.
- Operating income: Profit before interest and taxes.
- Net income: The final profit after all operating and administrative expenses.
Companies that maintain consistent gross margins outperform their peers in long-term profitability. Tracking income statement metrics is essential for performance benchmarking.
The income statement also highlights non-operational factors, like interest payments and one-time charges, that can distort profitability. Separating these items helps finance teams focus on core business performance.
Balance sheet
The balance sheet shows what a company owns, owes, and how much equity it has at a specific time. It’s a snapshot of financial health used to assess stability, liquidity, and long-term value.
This statement is built around a simple formula:
Assets = Liabilities + Equity
Here, assets include cash, inventory, property, and accounts receivable. Liabilities cover loans, accounts payable, and other debts. Equity, on the other hand, represents what’s left for owners after liabilities are paid.
Lenders and investors use the balance sheet to evaluate risk and track changes over time. If liabilities grow faster than assets, the business may face liquidity pressure. If equity rises steadily, the company is building long-term value.
It’s especially useful for spotting red flags. A sudden drop in cash, rising short-term debt, or a negative shareholder’s equity position signals financial strain.
For finance teams, the balance sheet informs decisions on debt management, investment, and cash allocation. It complements the income statement by showing whether profits are being reinvested or drained by liabilities.
When analyzed alongside other financial statements, the balance sheet helps build a complete picture of a company’s performance and its ability to grow sustainably.
How to use the balance sheet to assess stability and risk
The balance sheet helps teams evaluate whether a company can meet short-term obligations and sustain long-term operations. It highlights both financial strength and underlying risk.
- Evaluate short-term liquidity using the current ratio: The current ratio compares a company’s current assets to its current liabilities. A ratio above 1.0 means the business has enough liquid assets, like cash balance or receivables, to cover short-term obligations such as vendor payments or loan installments. A lower ratio may signal potential cash flow issues.
- Understand debt levels with the debt-to-equity ratio: The debt-to-equity ratio measures how much debt a company carries compared to its equity. A high debt-to-equity ratio (typically above 2.0) suggests the company relies heavily on borrowed funds, which increases financial risk, especially if interest rates rise or cash flow becomes inconsistent.
- Assess how well assets are positioned to support the business: A strong balance sheet does not just show total assets. It also shows how they are distributed. Companies with too much tied up in fixed company assets (like property or equipment) may struggle to respond quickly in a downturn. A mix of cash, inventory, and receivables allows more flexibility during financial shifts.
- Use retained earnings to track long-term performance: Retained earnings represent the portion of profits the company has kept instead of distributing to shareholders. Consistent growth in this area signals financial strength and smart reinvestment. If retained earnings are negative, it may point to accumulated losses or ineffective use of profits.
- Identify financial red flags before they escalate: Patterns like rising liabilities, shrinking cash reserves, or unpaid receivables can be early indicators of financial stress. Regular balance sheet reviews help teams catch these trends early and adjust spending.
Cash flow statement
The cash flow statement tracks how money moves in and out of a business. It shows how well the company generates cash to fund operations, pay debts, and invest in growth.
Unlike the income statement, which shows profit, the cash flow statement shows actual liquidity. A business can report a profit but still run into trouble if it does not manage cash well.
The statement is divided into three sections:
- Operating activities: Cash from core business operations like sales, supplier payments, and payroll.
- Investing activities: Cash spent or received from buying or selling assets like equipment or property.
- Financing activities: Cash from loans, equity financing, or dividend payments.
Together, these sections reveal how the company funds its business activities and whether it can sustain itself without external help.
Around 60% of small and midsize businesses said cash flow visibility is their top financial challenge. This highlights why the cash flow statement matters. It gives your finance teams a clear picture of real-time solvency.
Positive cash flow from operations signals strong internal health. Even with reported profits, negative operating cash flow may point to problems like delayed receivables or high overhead.
The cash flow statement also helps forecast the runway. If a company burns more cash than it brings in, leaders can adjust spending, delay investments, or raise funding before running out of resources. Reviewing cash flow regularly helps businesses stay agile, avoid liquidity crunches, and plan growth from a position of strength.
How can cash flow history help forecast future performance?
Cash flow patterns reveal how a business earns, spends, and manages its money over time. Analyzing those patterns helps finance teams forecast whether the company can support growth, survive slow periods, or absorb unexpected costs.
Historical cash flow data shows seasonality, sales cycles, and recurring expenses. For example, a retail business may see cash spikes in Q4 but tighter liquidity in Q1. Recognizing these trends allows for more accurate forecasting and better cash planning.
Operating cash flow trends indicate whether a company's revenue consistently turns into cash. If past data shows a widening gap between net income and cash flow, it may signal billing delays, rising expenses, or operational inefficiencies that need attention before scaling.
Businesses can spot trends, build rolling forecasts, and set trigger points for action by comparing cash inflows and outflows over multiple periods. These trigger points may include cutting expenses, raising working capital, or delaying purchases.
How do these statements work together to drive business decisions?
Financial statements are most effective when viewed together. Each statement highlights a different performance aspect, but their combined insight gives finance teams a full picture of the business.
The income statement tracks profitability over time. The balance sheet reflects the company’s financial position at a specific point. The cash flow statement shows how money moves in and out of the business. When analyzed together, they reveal not just outcomes but causes.
For instance, strong net income may suggest growth, but the business may be under financial pressure if the balance sheet shows rising debt and the cash flow statement shows negative operating cash. Used in isolation, those signals are easy to miss. Together, they highlight risk early and clearly.
This integrated view supports better decision-making. Finance teams can see how profit impacts cash, how equity grows through retained earnings, and how assets and liabilities shift over time. Patterns that show up in one statement often connect directly to movement in another.
Finance teams that consolidate insights across these reports are more than twice as likely to support long-term strategy successfully. That’s because decision-making improves when a company's financial performance, risk, and liquidity are understood in context.
When reviewed side by side, these statements become more than compliance tools. They form the foundation for strategic planning, operational alignment, and confident financial leadership.
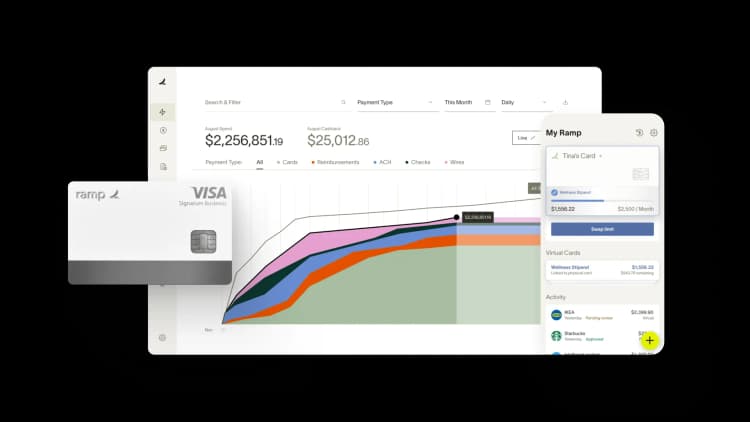
Get real-time performance insights with Ramp's live reporting and AI-powered analytics
Financial statements lose value when they're outdated or incomplete. You need current data to make informed decisions, but manual processes and delayed syncs mean you're often working with stale numbers that don't reflect what's actually happening in your business.
Ramp's AI-powered accounting software gives you real-time visibility into your financial performance so you can act on accurate data instead of waiting for month-end reports. Every transaction is coded, categorized, and synced as it happens, so your financial statements reflect today's reality rather than last week's snapshot.
Here's how Ramp delivers real-time performance insights:
- Live spend visibility: Track expenses across departments, vendors, and categories in real time so you can spot trends, identify overspending, and adjust budgets before problems compound
- Automated transaction coding: Ramp's AI codes transactions across all required fields as they post, ensuring your P&L and balance sheet stay current without manual data entry
- Dynamic reporting: Build custom reports that update automatically as new transactions flow through, so you're analyzing live data instead of static exports
Try an interactive demo to see how Ramp transforms financial reporting.

FAQs
An independent third-party auditor reviews audited financial statements to confirm accuracy and compliance with accounting standards. Unaudited statements are prepared internally and may be used for internal decision-making or early reporting but lack external validation.
Businesses should review financial statements monthly at minimum to catch issues early and track performance trends. Fast-growing or high-volume companies may review weekly or even daily metrics, especially for cash flow and expense management.
Finance teams often prepare customized reports for executives, department heads, or board members. These versions may highlight specific KPIs, trends, or cost centers while maintaining alignment with the official financial statements.


“Most banks treat the back office as a cost to keep down. We treat ours as a return to compound, which is why we run it on Ramp. Now we put our clients on Ramp, too.”
Patrick Gaughen
President & COO, Hingham Institution for Savings

“Browserbase builds infrastructure so AI agents can do real work. Ramp is doing the same for finance. It’s not another tool. It’s a system purpose-built for AI-driven finance, and that’s why we chose Ramp as our financial operating system from day one.”
Paul Klein IV
Founder & CEO, Browserbase

“We used to pay up to $20k a year for our AP platform. With Ramp, we’re earning back well over that amount. That's money that belongs to the mission now, not to the back-office software.”
Heidi Coffer
Chief Financial Officer, Boys & Girls Clubs of San Francisco

“The tricky thing about corporate travel policy is timing. We didn't need a stricter policy. We needed the policy to show up earlier. With Ramp Travel, it finally does.”
Keith Frantz
Director of Enterprise Risk Management, Prosper

“We're accountable to our funders, our partners, and the families we serve. That accountability starts with how we manage every dollar. Ramp makes it easy for our team to spend wisely, track in real time, and keep overhead low so more resources reach the families navigating infertility.”
Rachel Fruchtman
CFO, Jewish Fertility Foundation

“Each member of our team has an outsized impact due to our focus on using high-leverage tools like Ramp.”
Lauren Feeney
Controller, Perplexity

“With Ramp, we haven’t had to add accounting headcount to keep up with growth. The biggest takeaway is that instead of hiring our way through it, we fixed the workflow so we can keep supporting the organization as we scale.”
Melissa M.
VP of Accounting at Brandt Information Services

“In the public sector, every hour and every dollar belongs to the taxpayer. We can't afford to waste either. Ramp ensures we don't.”
Carly Ching
Finance Specialist, City of Ketchum
