
- What is variance analysis?
- Types of variance in finance
- Favorable vs. unfavorable variances
- How to perform variance analysis
- Best practices and tips for effective variance analysis
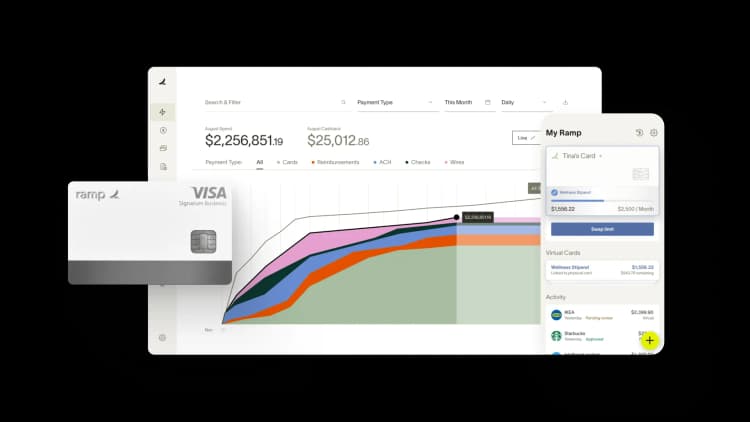
- Track budget vs. actuals in real time with Ramp's automated spend visibility
Variance analysis helps businesses grasp the differences between planned financial outcomes and actual results. By comparing budgeted figures to actual performance, variance analysis pinpoints where things went off track and why. This enables you to see where your business is performing well or poorly and provides insights for informed strategic decisions.
Whether you’re a small business owner or a financial manager, mastering variance analysis is important to your organization’s financial success. In this post, we'll discuss why variance analysis is important, cover the variance types and how to calculate them, go over the variance analysis process, and share some best practices.
What is variance analysis?
Variance analysis measures the gap between planned or budgeted financial outcomes and your actual results. This process helps you understand the reasons for these differences by giving you insight into your financial performance and operational efficiency.
The main goal of variance analysis is to understand why results deviate from plans. Deviations can stem from factors such as changes in market conditions, operational inefficiencies, pricing adjustments, or surprise expenses. Digging into the root causes of variances helps you control overhead costs, improve resource allocation, and enhance your budgeting and forecasting.
Financial variance analysis highlights both strengths and weaknesses. A positive variance might indicate higher sales or cost savings, while a negative one could signal overspending or a revenue decline.
Regular variance analysis allows you to manage your financial health proactively, keeping a sharp eye on cost control and shaping realistic forecasts and budgets. It also helps you promote a culture of accountability and performance for your team.
Types of variance in finance
There are a number of different types of variance analysis. Each type focuses on a specific aspect of financial performance, identifying problem areas and opportunities to improve. The most common types include:
- Sales variance: Measures the difference between actual sales and budgeted sales. Factors such as demand, pricing strategies, or sales team performance can influence this number. A positive sales variance means sales exceeded expectations, while a negative one suggests underperformance.
- Revenue variance: Tracks the difference between actual and budgeted revenue, taking into account both sales volume and price fluctuations. This helps you understand how pricing strategies and sales performance affect overall revenue.
- Cost variance: Examines the differences between actual and budgeted costs, including variances in direct materials, direct labor, and manufacturing overhead. By identifying cost variances, businesses can manage spending and improve cost efficiency.
- Profit variance: Compares actual profit to expected profit. A positive profit variance means better-than-anticipated performance, while a negative variance may indicate declining profit margins or increased expenses. It's heavily impacted by revenue and cost variances.
Some other common types of variances are:
- Budget variance: Shows the difference between your company’s budgeted or planned financial performance and its actual financial performance over a specific period. It helps you understand how well your business adheres to your financial plans and where discrepancies come up.
- Operational variance: Measures deviations in day-to-day business activities, such as production efficiency, employee productivity, and supply chain performance. It highlights areas where operational processes may need tweaking to boost efficiency and reduce costs.
- Efficiency variance: Refers to the difference between the actual amount of input used to produce a certain output level and the expected or standard amount of input that should have been used, given the level of output achieved
- Volume variance: Analyzes the difference between actual quantities sold or produced versus projected volumes. It isolates the impact of selling more or fewer units than planned, helping you determine whether revenue changes stem from demand fluctuations, market conditions, or sales execution rather than pricing decisions.
- Price variance: Measures the difference between actual selling prices or costs per unit compared to standard or budgeted prices. It reveals whether pricing strategies are performing as expected and identifies opportunities to optimize profit margins or negotiate better supplier terms.
Understanding these types of variance in finance empowers you to pinpoint exactly where your business is excelling or struggling, enabling targeted improvements that drive better performance and strategic decision-making.
Favorable vs. unfavorable variances
A favorable variance occurs when results exceed expectations, such as achieving higher sales than forecasted or spending less on materials than budgeted. Unfavorable variances happen when reality falls short of plans, such as lower revenue or higher-than-expected expenses.
Context matters here. Higher production costs might seem negative, but if they resulted from increased demand requiring overtime to fulfill orders, that's actually good news. Similarly, lower marketing expenses could indicate missed opportunities rather than efficient spending.
These insights help you decide whether to replicate successful strategies or implement corrective measures to get back on track.
How to perform variance analysis
Conducting financial variance analysis requires a blend of quantitative and qualitative insights. Here's a step-by-step guide to conducting a thorough analysis:
1. Set benchmarks or budgets
Begin by establishing the baseline with your standard costs, which act as the benchmark against which you measure actual costs. You can pull these from historical data, industry benchmarks, or detailed cost estimation models. Compare these standards to the actual costs incurred during the reporting period.
2. Collect financial data
With your benchmarks set, collect the financial data for the review period. This includes revenue figures, cost information, sales volumes, and other pertinent metrics. Ensure that what you gather is accurate and current so you don’t draw misleading conclusions.
3. Calculate the variances
With data in hand, you can calculate variances for each category. These will differ depending on the level of detail and data available, but they generally involve pretty straightforward arithmetic. Here’s a list of each, along with the corresponding formula:
- Sales variance = Actual sales - Budgeted sales
- Revenue variance = (Actual price * Actual quantity) - (Budgeted price * Budgeted quantity)
- Cost variance = Actual cost - Budgeted cost
- Profit variance = Actual profit - Budgeted profit
- Budget variance = Actual amount - Budgeted amount
- Operational variance = Actual operational costs - Budgeted operational costs
- Efficiency variance = (Actual input used - Standard input allowed) * Standard price
- Volume variance = (Actual quantity - Budgeted quantity) * Budgeted price
- Price variance = (Actual price - Budgeted price) * Actual quantity
4. Analyze the variance causes
Begin by sorting variances into internal and external factors. Internal factors can include operational inefficiencies, such as low productivity or ineffective resource use. Management decisions, such as pricing strategies or budget allocation, may also play a role.
External factors may include changes in market demand, economic fluctuations, or variations in supplier pricing. New regulatory requirements might also be a factor.
Engage key stakeholders from relevant departments to offer insights into potential causes. Analyze actual performance data alongside historical trends to identify patterns and anomalies.
5. Classify the variances
Categorize the variances into controllable and uncontrollable factors to prioritize where you should focus your efforts to improve.
Controllable variances are those your organization can directly influence, such as labor efficiency, production processes, and maverick spending. To address these, implement targeted improvements, such as enhanced training programs or renegotiated supplier contracts.
Uncontrollable variances, such as economic downturns or shifts in market demand, are beyond your influence. However, you can develop risk management strategies and contingency plans. This might mean diversifying suppliers, adjusting pricing, or building financial reserves.
6. Take action
Based on your analysis and your variance report, get to work on next steps.
For negative variances, this may involve adjusting pricing strategies to better align with market conditions, optimizing resource allocation to eliminate inefficiencies, or refining operational processes to improve productivity. For instance, if labor costs exceed the budget, consider retraining staff or investing in automation to boost efficiency.
Favorable variances offer opportunities for growth. If sales performance surpasses expectations, businesses may expand successful marketing campaigns or increase production capacity to satisfy demand. Ongoing monitoring ensures corrective actions remain effective over time and allows for adjustments as new data becomes available.
Example: Variance analysis in action
Let's take a look at how variance in finance can work in the real world.
Say your company forecasted monthly sales at $500,000 but only reached $450,000. This $50,000 negative variance signals a potential shortfall in demand, prompting an investigation into pricing, marketing, product performance, or competitive pressures.
After analyzing the data, your company discovers that a competitor's aggressive pricing strategy was capturing more market share. In response, you launch a targeted promotional campaign and adjust your pricing structure for key products. You also invest in enhanced sales training to better communicate value propositions to customers.
This example shows how variance analysis can identify problems early and guide specific actions that can help you course-correct and improve future performance.
Best practices and tips for effective variance analysis
Variance analysis delivers the best results when you follow proven best practices such as:
- Analyze both positive and negative variances: While unfavorable variances indicate issues to correct, examining positive variances reveals what's working well and opportunities to replicate success across other areas
- Dig deep into root causes: Identifying a variance is just the starting point. Investigate the underlying factors that caused the deviation to implement meaningful solutions rather than quick fixes.
- Verify data accuracy and consistency: Using outdated or incorrect data can lead to faulty conclusions. Make sure your information is current, reliable, and sourced from consistent reporting methods.
- Consider non-financial factors: Looking beyond the numbers helps you capture operational, market, or human elements, such as employee productivity, customer behavior, or competitive dynamics that influence financial performance
- Keep analysis focused and actionable: Overly complex models or unnecessary details can slow decision-making. Concentrate on metrics that directly relate to your business objectives.
- Use standardized templates: Consistent reporting formats make it easier to compare variances across periods and departments while reducing the time spent on analysis preparation and increasing accuracy
- Conduct regular review cycles: Establish monthly or quarterly variance analysis schedules to catch issues early and track progress on corrective actions, ensuring continuous improvement in financial performance
Following these best practices will help you maximize the value of financial variance analysis and make better business decisions.
Track budget vs. actuals in real time with Ramp's automated spend visibility
Budget variances catch finance teams off guard when tracking happens in spreadsheets or after the fact. You need real-time visibility into how actual spend compares to budget so you can course-correct before small overages become major problems.
Ramp's accounting automation software gives you continuous spend tracking across departments, projects, and cost centers. You can track transactions by employee, department, vendor, or any custom field that matters to your business. When you need to dig deeper, Ramp's reporting tools let you filter, segment, and export data to understand patterns, spot anomalies, and share insights with stakeholders.
Policy enforcement happens at the point of transaction. Ramp flags out-of-policy spend before it posts, routes exceptions to the right approvers, and blocks transactions that violate hard rules. You set the guardrails, and Ramp enforces them automatically so teams stay compliant without constant oversight.
Try a demo to see how Ramp helps finance teams eliminate budget surprises.

FAQs
Tools that help with variance analysis include accounting software, which automates data collection and reporting; spreadsheet programs such as Excel, and enterprise resource planning (ERP) systems, which integrate financial data across departments, ensuring comprehensive and accurate variance tracking.
Variance analysis compares financial outcomes with expected results to identify deviations and their causes. Trend analysis examines financial data over time to uncover patterns, such as growth or decline. These patterns provide insights into long-term performance and help forecast future outcomes—variance highlighting immediate discrepancies and trends emphasizing broader shifts.
Yes. For instance, variance analysis provides valuable insights into operational performance. When applied to production output, employee productivity, and quality control, it helps reveal underlying performance trends and allows for targeted improvements across various areas of the organization.

“Most banks treat the back office as a cost to keep down. We treat ours as a return to compound, which is why we run it on Ramp. Now we put our clients on Ramp, too.”
Patrick Gaughen
President & COO, Hingham Institution for Savings

“Browserbase builds infrastructure so AI agents can do real work. Ramp is doing the same for finance. It’s not another tool. It’s a system purpose-built for AI-driven finance, and that’s why we chose Ramp as our financial operating system from day one.”
Paul Klein IV
Founder & CEO, Browserbase

“We used to pay up to $20k a year for our AP platform. With Ramp, we’re earning back well over that amount. That's money that belongs to the mission now, not to the back-office software.”
Heidi Coffer
Chief Financial Officer, Boys & Girls Clubs of San Francisco

“The tricky thing about corporate travel policy is timing. We didn't need a stricter policy. We needed the policy to show up earlier. With Ramp Travel, it finally does.”
Keith Frantz
Director of Enterprise Risk Management, Prosper

“We're accountable to our funders, our partners, and the families we serve. That accountability starts with how we manage every dollar. Ramp makes it easy for our team to spend wisely, track in real time, and keep overhead low so more resources reach the families navigating infertility.”
Rachel Fruchtman
CFO, Jewish Fertility Foundation

“Each member of our team has an outsized impact due to our focus on using high-leverage tools like Ramp.”
Lauren Feeney
Controller, Perplexity

“With Ramp, we haven’t had to add accounting headcount to keep up with growth. The biggest takeaway is that instead of hiring our way through it, we fixed the workflow so we can keep supporting the organization as we scale.”
Melissa M.
VP of Accounting at Brandt Information Services

“In the public sector, every hour and every dollar belongs to the taxpayer. We can't afford to waste either. Ramp ensures we don't.”
Carly Ching
Finance Specialist, City of Ketchum
