Top line vs. bottom line: Key differences and strategies

- What is top line vs. bottom line?
- How to calculate top line and bottom line
- Key differences between top line and bottom line
- Examples: Top line vs. bottom line in action
- Strategies to grow top line revenue
- Strategies to improve bottom line profitability
- When to focus on top line vs. bottom line growth
- How top line and bottom line work together
- Improve your bottom line with smarter financial operations
The top line refers to a company's total revenue, while the bottom line represents net income after all expenses. Both numbers sit at opposite ends of your income statement and tell very different stories about your company's financial health.
Understanding the relationship between these two figures and knowing how to improve each can mean the difference between a business that grows sustainably and one that stalls out.
What is top line vs. bottom line?
The terms top line and bottom line come from their literal positions on an income statement. Revenue sits at the top, and net income lands at the bottom. Everything in between (costs, expenses, taxes) determines how much of your revenue you actually keep.
What is top line revenue?
Top line revenue is your total income from sales of goods or services before any deductions. It's the first number on your income statement and reflects how well you're generating sales in the market.
- Top line revenue: Total income from sales of goods or services
- Also called: Gross revenue, total sales, revenue top line
- What it measures: Sales performance and market demand
What is the bottom line of a company?
The bottom line is the net income remaining after subtracting all expenses, taxes, and costs from revenue. It shows your actual profitability, how much money your company truly earns after everything is accounted for.
- Bottom line: Net profit after all expenses are deducted
- Also called: Net income, net profit, bottom line profit
- What it measures: Overall financial health and profitability
How to calculate top line and bottom line
Both metrics are straightforward to calculate once you know what goes into each formula.
Top line revenue formula
Top line revenue = Total units sold * Price per unit
If you sell 10,000 subscriptions at $50 each, your top line revenue is $500,000. This is the starting point on your income statement. Everything else flows down from here.
Bottom line formula
Bottom line = Total revenue – (COGS + Operating expenses + Taxes + Interest)
Each component chips away at your revenue:
- COGS: Direct costs of producing your product or service
- Operating expenses: Rent, salaries, marketing, and other day-to-day costs
- Taxes: Federal, state, and local tax obligations
- Interest: Payments on debt or borrowed capital
What remains after all these deductions is your net income, the profit you can reinvest, distribute to shareholders, or save.
Key differences between top line and bottom line
Your top line shows how well you generate revenue, while your bottom line shows how well you manage profit. A company can have impressive sales and still lose money if costs spiral out of control.
| Factor | Top line | Bottom line |
|---|---|---|
| Definition | Total revenue/sales | Net income after expenses |
| Location on income statement | First line | Last line |
| What it measures | Sales performance | Profitability |
| Influenced by | Pricing, sales volume, market demand | Costs, expenses, efficiency |
| Growth focus | Revenue expansion | Cost control and margins |
| Common terms | Gross revenue, top-line growth | Net profit, net earnings, bottom-line growth |
| Business priority | Growth, market share, new customers | Profitability, sustainability, cash flow |
Examples: Top line vs. bottom line in action
Here's how a software company grew revenue but saw profits shrink:
| Metric | FY24 | FY25 |
|---|---|---|
| Gross revenue | $150 million | $180 million |
| COGS | $30 million | $40 million |
| Operating expenses | $70 million | $90 million |
| Depreciation and amortization | $10 million | $12 million |
| Taxes | $8 million | $10 million |
| Net income | $32 million | $28 million |
Despite strong top-line revenue growth (up $30 million), the company's net income declined due to rising cost of goods sold (COGS) and operating expenses. This is a classic case of gross revenue climbing while net income falls. The 20% top line increase masked a 12.5% bottom line decline, meaning each new dollar of revenue cost more to generate than the last. Without tighter cost controls, that gap will only widen.
A regional retail chain tells a similar story. It grew total sales from $20 million to $26 million, but supply chain issues and rising labor costs offset that growth:
| Metric | FY24 | FY25 |
|---|---|---|
| Gross revenue | $20 million | $26 million |
| COGS | $8 million | $11 million |
| Operating expenses | $7 million | $9.5 million |
| Depreciation and amortization | $1 million | $1.5 million |
| Taxes | $500 thousand | $1 million |
| Net income | $3.5 million | $3 million |
Even as the company expanded its customer base and product lines, cost pressures ate into its bottom line. A 30% jump in revenue translated to a 14% drop in profit. The pattern mirrors the software company above: top line growth alone doesn't guarantee profitability when expenses grow even faster. To stabilize future margins, it turned to vendor partnerships and inventory automation.
The reverse can happen too. A professional services firm held revenue steady at $12 million but cut operating expenses by renegotiating vendor contracts and automating invoice processing, boosting net income from $1.5 million to $2.2 million.
| Metric | FY24 | FY25 |
|---|---|---|
| Gross revenue | $12 million | $12 million |
| COGS | $4 million | $4 million |
| Operating expenses | $5.5 million | $4.8 million |
| Depreciation and amortization | $500 thousand | $500 thousand |
| Taxes | $500 thousand | $500 thousand |
| Net income | $1.5 million | $2.2 million |
With zero top line growth, the firm improved bottom line profitability by 47% through cost discipline alone. Bottom line growth doesn't always require more revenue. Sometimes the fastest path to higher profit runs through smarter spending, not bigger sales numbers.
Strategies to grow top line revenue
Top-line growth means increasing total revenue through sales expansion. The goal is to bring in more money before worrying about what you keep.
1. Expand your customer base
Reach new customers through targeted marketing campaigns, referral programs, or new sales channels. Focused campaigns that speak to your ideal customer profile attract higher-quality leads and improve conversion rates.
2. Increase prices strategically
Raise prices where the value you deliver supports it without driving customers away. Test price sensitivity with small adjustments before rolling out broader changes.
3. Launch new products or services
Diversify your offerings to capture additional revenue streams from both existing and new customers. Upselling and cross-selling complementary products can raise average deal size and overall revenue.
4. Enter new markets
Expand geographically or into adjacent market segments to unlock new revenue. Strategic partnerships or acquisitions can accelerate this process and broaden your customer base faster than organic growth alone.
Strategies to improve bottom line profitability
Bottom-line growth comes from increasing net profit by managing costs and improving efficiency. You don't always need more revenue; sometimes you just need to keep more of what you already earn.
1. Automate manual financial processes
Reduce time spent on repetitive tasks such as expense reporting and invoice processing. Automation frees your finance team to focus on higher-value work instead of chasing receipts and reconciling statements.
2. Reduce operating expenses
Review recurring costs and eliminate or renegotiate where possible. Consolidating overlapping software platforms, for example, can cut licensing fees and simplify vendor management.
3. Eliminate wasteful spending
Identify duplicate subscriptions, unused software, or excessive spending categories. Real-time visibility into your spending helps you catch waste early, before it compounds into a margin problem.
4. Negotiate better vendor terms
Leverage your spending data to negotiate volume discounts or more favorable payment terms with suppliers. Even small improvements in input costs can meaningfully protect your margins over time.
5. Improve operational efficiency
Streamline workflows to reduce labor costs and processing time. Accounting automation is a prime example. Replacing manual data entry with automated categorization and reconciliation saves hours every month.
When to focus on top line vs. bottom line growth
Your company's financial priorities evolve as it grows. Context matters, what's right for an early-stage startup looks very different from what a mature company needs.
| Business stage | Priority focus | Reason |
|---|---|---|
| Startup | Top-line growth | Capture market share, build customer base |
| Growth phase | Balanced optimization | Scale sustainably, avoid overexpansion |
| Maturity | Bottom-line growth | Improve margins, maximize shareholder value |
A simpler way to think about it:
- Focus on top line when: Building market share, launching new products, entering a growth phase
- Focus on bottom line when: Preparing for profitability, facing investor pressure, optimizing mature operations
- Focus on both when: Scaling sustainably, balancing growth with financial discipline
Evaluate these metrics together to align your strategy with your current phase.
How top line and bottom line work together
Revenue shows your company's ability to attract and retain customers, but high revenue alone doesn't mean you're profitable. You also need to manage expenses and optimize operations to drive bottom-line growth.
Strong top-line growth without bottom-line improvement may signal inefficiency: you're spending more than you should to generate each dollar of revenue. Improving the bottom line without top-line growth may indicate underinvestment: you're cutting costs at the expense of future growth.
Investors, lenders, and executives track both figures to assess financial performance. A growing top line may attract attention, but consistent bottom-line results signal sound management and long-term viability. Both metrics together reveal the full financial picture.
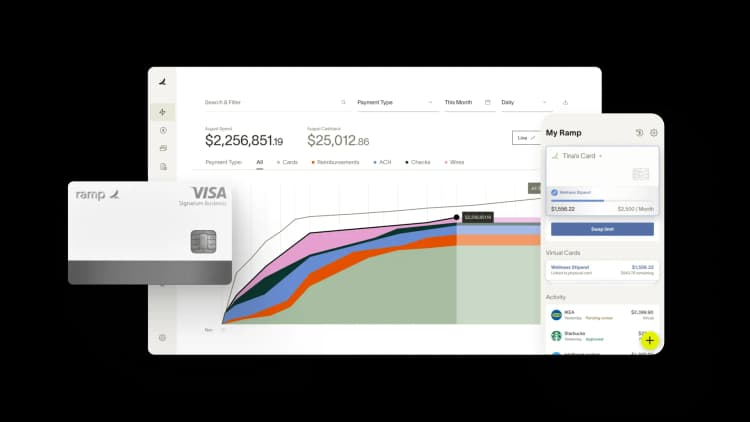
Improve your bottom line with smarter financial operations
Growing revenue while maintaining healthy profit margins requires balancing investment in growth initiatives (hiring talent, expanding marketing spend, upgrading technology) with disciplined cost control. Many finance teams find themselves caught between aggressive growth targets and pressure to improve profitability, often sacrificing one for the other.
Ramp's expense management platform helps you achieve both goals by automating the tedious work that eats into your team's productivity. Instead of spending hours categorizing receipts, chasing down missing documentation, or manually reconciling credit card statements, your finance team can focus on strategic initiatives that drive revenue.
Ramp automatically captures and categorizes expenses in real time, matching receipts to transactions and flagging policy violations before they become costly mistakes. This automation doesn't just save time; it transforms your finance team from reactive processors to proactive business partners who can identify savings opportunities and reduce costs.
The platform's real-time spending controls and insights give you complete visibility into where every dollar goes. You can set custom spending limits by category, vendor, or employee, ensuring marketing dollars go toward high-ROI campaigns rather than unnecessary subscriptions.
When you spot redundant software licenses or identify vendors charging above-market rates, you can immediately reallocate those funds toward revenue-generating activities. This granular control means you're not just cutting costs blindly; you're making intelligent decisions about where to invest for maximum impact.
By eliminating manual expense reports and providing instant visibility into spending patterns, Ramp helps you reduce operational costs by up to 5% while freeing up your finance team to focus on strategic growth initiatives. That's the power of turning expense management from a cost center into a profit driver.
Try an interactive demo to see how Ramp can help you cut costs and grow your bottom line.

FAQs
The bottom line in business refers to a company's net income or profit after deducting all expenses, taxes, and costs from total revenue. It's the final figure on an income statement and the clearest indicator of whether a company is actually making money.
No. Top line revenue is total sales before any deductions, while gross profit is revenue minus cost of goods sold (COGS). Gross profit appears below the top line on an income statement because it accounts for the direct costs of producing your product or service.
Yes. A company can grow revenue while expenses grow even faster, resulting in low or negative net income. This often happens when companies invest heavily in expansion or operate inefficiently, which is exactly why tracking both metrics matters.
There's no difference. Bottom line and net income are interchangeable terms that both refer to the profit remaining after all expenses have been subtracted from revenue.
EBITDA (earnings before interest, taxes, depreciation, and amortization) is neither. It sits between the top line and bottom line on the income statement, measuring operational profitability before non-operating costs. The bottom line (net income) includes all these deductions, making it the more complete profitability measure.


“Most banks treat the back office as a cost to keep down. We treat ours as a return to compound, which is why we run it on Ramp. Now we put our clients on Ramp, too.”
Patrick Gaughen
President & COO, Hingham Institution for Savings

“Browserbase builds infrastructure so AI agents can do real work. Ramp is doing the same for finance. It’s not another tool. It’s a system purpose-built for AI-driven finance, and that’s why we chose Ramp as our financial operating system from day one.”
Paul Klein IV
Founder & CEO, Browserbase

“We used to pay up to $20k a year for our AP platform. With Ramp, we’re earning back well over that amount. That's money that belongs to the mission now, not to the back-office software.”
Heidi Coffer
Chief Financial Officer, Boys & Girls Clubs of San Francisco

“The tricky thing about corporate travel policy is timing. We didn't need a stricter policy. We needed the policy to show up earlier. With Ramp Travel, it finally does.”
Keith Frantz
Director of Enterprise Risk Management, Prosper

“We're accountable to our funders, our partners, and the families we serve. That accountability starts with how we manage every dollar. Ramp makes it easy for our team to spend wisely, track in real time, and keep overhead low so more resources reach the families navigating infertility.”
Rachel Fruchtman
CFO, Jewish Fertility Foundation

“Each member of our team has an outsized impact due to our focus on using high-leverage tools like Ramp.”
Lauren Feeney
Controller, Perplexity

“With Ramp, we haven’t had to add accounting headcount to keep up with growth. The biggest takeaway is that instead of hiring our way through it, we fixed the workflow so we can keep supporting the organization as we scale.”
Melissa M.
VP of Accounting at Brandt Information Services

“In the public sector, every hour and every dollar belongs to the taxpayer. We can't afford to waste either. Ramp ensures we don't.”
Carly Ching
Finance Specialist, City of Ketchum
