How to use opportunity cost to make financially sound decisions

- What is opportunity cost?
- Real-world opportunity cost examples
- Why opportunity cost matters in decision-making
- Track opportunity costs in real time with Ramp's spend visibility and analytics
Opportunity cost is the value of the next best alternative you forgo when making a decision. Understanding this concept helps you allocate your limited resources more effectively. It empowers you to make informed decisions that maximize returns and optimize resource allocation.
What is opportunity cost?
Opportunity cost is the potential benefit you lose out on when you choose one option over another. For example, if you’re a small business owner who can either invest in new equipment or expand your marketing efforts, the opportunity cost of purchasing equipment is the potential returns you’d have gained from increased sales through the marketing campaign.
Opportunity cost helps you evaluate trade-offs—choices that are fundamental to the decision-making process in business decisions.
Types of costs involved
Calculating opportunity cost involves considering different types of costs. Here's a breakdown:
- Explicit costs: These are the direct costs you can easily measure, such as purchasing new equipment, paying for labor, buying supplies, and other business expenses
- Implicit costs: These are harder to measure but are still critical. For example, the time you spend managing a project could have been used for another income-generating opportunity.
- Sunk costs: These costs are already incurred and should not affect future decisions. For example, you can’t recover money spent on a past project, so you shouldn't factor into future opportunity cost calculations.
Understanding these costs ensures that your opportunity cost calculation is more accurate, allowing you to make better investment decisions and better manage your capital structure.
Always ignore sunk costs when calculating opportunity cost. You can't recover them, so they shouldn't influence future decision-making.
The opportunity cost formula
The opportunity cost formula is simple to use:
Opportunity Cost = Benefit of the Foregone Option − Benefit of the Chosen Option = Benefit of the Foregone Option
This formula helps you compare the potential returns from two different options, showing you what you give up by choosing one path over another.
Example calculation:
Let’s say you’re choosing between two options for your business:
- Option A: Invest in new equipment that is expected to increase efficiency, with a projected return on investment (ROI) of $10,000
- Option B: Invest in marketing that could increase sales, with a potential return of $15,000
Opportunity cost = $15,000 (Benefit of Option B) - $10,000 (Benefit of Option A)
Opportunity cost = $5,000
In this case, the opportunity cost of choosing new equipment is $5,000—the potential benefit from the marketing investment you didn’t choose.
Real-world opportunity cost examples
Understanding opportunity cost becomes clearer when you apply it to real-world situations. Here are practical examples to show how opportunity cost plays a pivotal role in everyday decision-making:
Opportunity cost in business decisions
For businesses, opportunity cost plays a critical role in decisions that involve capital allocation and resource management. Every business decision—from choosing between new equipment or marketing, to deciding on inventory management—involves trade-offs.
By considering opportunity cost, you can make smarter decisions, ensure optimal resource allocation, and maintain a positive cash flow for your business. This can involve comparing the rate of return from different investments and aligning decisions with long-term goals.
Use opportunity cost to assess long-term business decisions. This helps you choose between competing options and allocate resources effectively.
Choosing between investments
Imagine you own a small business and have to decide whether to invest in automation or expand your product line. By calculating the opportunity cost, you can weigh the trade-offs and choose the option that maximizes your expected returns.
Option | Investment | Expected ROI | Opportunity Cost |
|---|---|---|---|
A | Automation | $12,000 | $6,000 (the potential returns from expanding the product line) |
B | Product Line Expansion | $18,000 | - |
In this scenario, the opportunity cost of choosing automation is $6,000—the potential returns you give up by not expanding the product line.
The role of opportunity cost in investment decisions
Opportunity cost helps investors evaluate potential returns on multiple options. For example, if a business is deciding between purchasing new equipment or expanding operations, the opportunity cost is the projected returns they forego from the second option. By understanding the economic profit from each alternative, investors can make more strategic decisions.
Suppose you're comparing two investment opportunities for your business:
Option | Investment | Expected ROI | Opportunity Cost |
|---|---|---|---|
A | New Equipment | 8% | 4% (the additional return you could have gained from expanding operations) |
B | Expansion | 12% | - |
By choosing Option A, the opportunity cost is the potential 4% additional return you give up by not choosing Option B. This helps you identify which investment offers the best financial advantage.
Forecasting and projected returns
Forecasting helps you predict the projected returns of investment options. By factoring in opportunity cost, you can forecast the economic profit of different strategies and optimize their financial outcomes.
For example, when deciding whether to invest in automation or increase marketing efforts, use opportunity cost to predict the long-term returns from each option, ensuring the best possible allocation of resources.
Capital budgeting and advanced decision-making tools
When making long-term investment decisions, businesses often use capital budgeting techniques such as Net Present Value (NPV) and Internal Rate of Return (IRR) to evaluate potential projects. These methods involve comparing the present value of expected future cash flows against the cost of the investment, ensuring that cash flow management is optimized for sustained profitability and long-term growth.
- Net Present Value (NPV): The sum of the present values of future cash flows minus the initial investment. NPV helps you determine whether an investment is likely to generate positive returns.
- Internal Rate of Return (IRR): The discount rate that makes the NPV of an investment equal to zero. It’s used to evaluate the profitability of potential investments.
Incorporating opportunity cost into these methods means you compare not just the absolute benefits of an investment, but also the potential benefits it misses out on by choosing one investment over another.
Why opportunity cost matters in decision-making
Considering opportunity cost in decision-making helps you avoid suboptimal choices. When you understand the trade-offs of your decisions, you can better allocate your resources to maximize your return on investment and achieve the highest economic profit.
In business finance, not factoring in opportunity cost can lead to missed opportunities, poor resource management, and lower returns. By factoring opportunity cost into every decision, you can ensure that your choices align with your financial goals and drive long-term success.
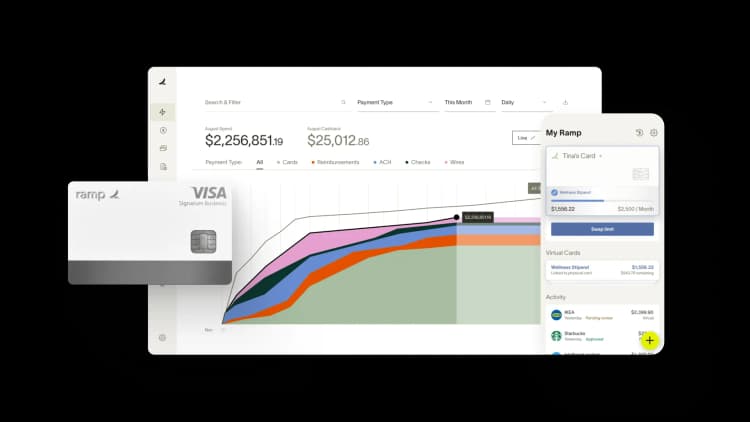
Track opportunity costs in real time with Ramp's spend visibility and analytics
Opportunity cost is invisible in most accounting systems—you see what you spent, but not what you gave up by spending it there. Ramp's accounting automation software surfaces the data you need to quantify these trade-offs and make smarter resource allocation decisions across your business.
Ramp gives you complete visibility into spending patterns, budget utilization, and resource allocation in real time. You can track spend by department, project, vendor, or custom dimension, then compare actual usage against budgets to identify where resources are tied up versus where they could create more value. When you see that one team is consistently underspending while another is overspending, you can reallocate resources before the quarter ends.
Here's how Ramp helps you quantify opportunity cost:
- Real-time spend tracking: Monitor expenses as they happen across all departments and projects, so you can spot misallocated resources immediately instead of discovering them at month-end
- Custom reporting and analytics: Build reports that surface spending patterns, vendor concentration, and resource allocation trends so you can model alternative scenarios and calculate the true cost of current decisions
- Automated categorization: Ramp codes every transaction automatically across all required fields, giving you accurate data to analyze trade-offs without manual cleanup
Learn more about how Ramp's spend management platform helps finance teams make data-driven resource allocation decisions.

FAQs
To calculate opportunity cost, subtract the benefit of the chosen option from the benefit of the foregone option. For example, if investing in new equipment yields a $10,000 return and expanding marketing yields $15,000, the opportunity cost is $5,000.
Yes, opportunity cost plays a role in personal finance decisions, such as choosing between saving for the future or spending on current needs. By calculating the potential benefits of both options, you can make better choices.
Don't miss these


“Most banks treat the back office as a cost to keep down. We treat ours as a return to compound, which is why we run it on Ramp. Now we put our clients on Ramp, too.”
Patrick Gaughen
President & COO, Hingham Institution for Savings

“Browserbase builds infrastructure so AI agents can do real work. Ramp is doing the same for finance. It’s not another tool. It’s a system purpose-built for AI-driven finance, and that’s why we chose Ramp as our financial operating system from day one.”
Paul Klein IV
Founder & CEO, Browserbase

“We used to pay up to $20k a year for our AP platform. With Ramp, we’re earning back well over that amount. That's money that belongs to the mission now, not to the back-office software.”
Heidi Coffer
Chief Financial Officer, Boys & Girls Clubs of San Francisco

“The tricky thing about corporate travel policy is timing. We didn't need a stricter policy. We needed the policy to show up earlier. With Ramp Travel, it finally does.”
Keith Frantz
Director of Enterprise Risk Management, Prosper

“We're accountable to our funders, our partners, and the families we serve. That accountability starts with how we manage every dollar. Ramp makes it easy for our team to spend wisely, track in real time, and keep overhead low so more resources reach the families navigating infertility.”
Rachel Fruchtman
CFO, Jewish Fertility Foundation

“Each member of our team has an outsized impact due to our focus on using high-leverage tools like Ramp.”
Lauren Feeney
Controller, Perplexity

“With Ramp, we haven’t had to add accounting headcount to keep up with growth. The biggest takeaway is that instead of hiring our way through it, we fixed the workflow so we can keep supporting the organization as we scale.”
Melissa M.
VP of Accounting at Brandt Information Services

“In the public sector, every hour and every dollar belongs to the taxpayer. We can't afford to waste either. Ramp ensures we don't.”
Carly Ching
Finance Specialist, City of Ketchum
